It’s a nightmare if we ever used to work on any Projects / Programming languages without Debugger. The difficulty in quickly identifying where the problem is in source code is number 1 motivation killer for any developer.
When working on PHP projects, PHPStorm is always my “1st goto choice IDE”.
This excellent IDE provide me everything I need for development, without have to use another tools, (Database connection, Terminal, Code Assistant … especially Debugger)
However, setting Debugger for PHP project sometime is tricky and not so easy for newbie, this is a step by step guide to set up debugger in for PHP projects using XDebug and IDE PHPStorm.
1. (optional) Check & upgrade PHP version to latest version
1.1 Check your PHP version
php -v1.2 Upgrade it to latest version (PHP 8 as for now)
brew tap shivammathur/php
brew upgrade php
brew install shivammathur/php/php@8.0
brew link --overwrite --force php@8.0
2. Install XDebug (XDebug doc)
2.1 Install XDebug using PECL
pecl install xdebug2.2 (optional) Check if XDebug install successfully
php -v

### Output
PHP 8.0.8 (cli) (built: Jul 13 2021 01:42:11) ( NTS )
Copyright (c) The PHP Group
Zend Engine v4.0.8, Copyright (c) Zend Technologies
    with Xdebug v3.0.4, Copyright (c) 2002-2021, by Derick Rethans
    with Zend OPcache v8.0.8, Copyright (c), by Zend Technologies
3. Install Composer (PHP package manager)
3.1 Create a composer folder
mkdir -p ~/composer3.2 Create a installer.sh & set correct permission in the composer folder
cd ~/composer
touch installer.sh && chmod +x installer.sh
vi installer.sh
3.3 Paste the following content in installer.sh
#!/bin/sh

EXPECTED_CHECKSUM="$(php -r 'copy("https://composer.github.io/installer.sig", "php://stdout");')"
php -r "copy('https://getcomposer.org/installer', 'composer-setup.php');"
ACTUAL_CHECKSUM="$(php -r "echo hash_file('sha384', 'composer-setup.php');")"

if [ "$EXPECTED_CHECKSUM" != "$ACTUAL_CHECKSUM" ]
then
    >&2 echo 'ERROR: Invalid installer checksum'
    rm composer-setup.php
    exit 1
fi

php composer-setup.php --quiet
RESULT=$?
rm composer-setup.php
exit $RESULT
3.4 Save & execute installer.sh file
bash installer.sh3.5 At this step you should have composer.phar inside ~/composer folder
3.6 Add an composer alias in your .bash_profile or .zshrc file (I’m using ZSH), this will allow you to use composer as shortcut
echo "alias composer=\"php ~/composer/composer.phar\"" >> ~/.zshrc3.7 (optional) Check if composer install successfully
composer about

### Output
Composer - Dependency Manager for PHP - version 2.1.3
Composer is a dependency manager tracking local dependencies of your projects and libraries.
See https://getcomposer.org/ for more information.
4. Install XDebug Helper Chrome extension
Go to Chrome Web Store, search for XDebug and install it

5. Add & config built-in PHP server in PHPStorm
5.1 In PHPStorm, select Run/Edit Configurations

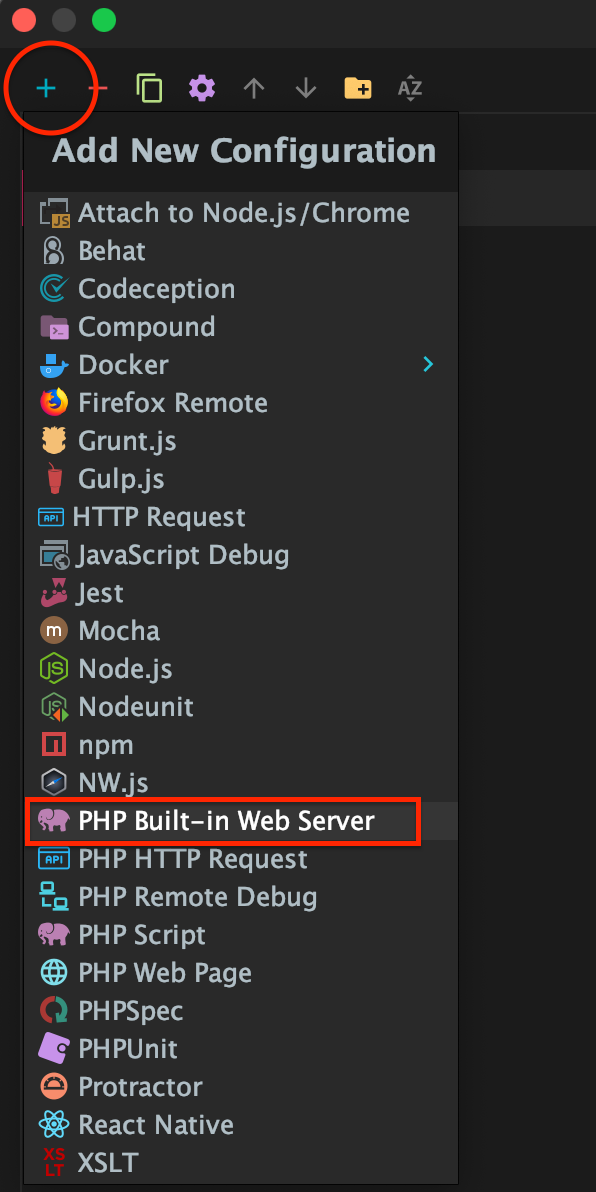
5.2 Add a new PHP built-in server
5.3 Set the configuration values as below
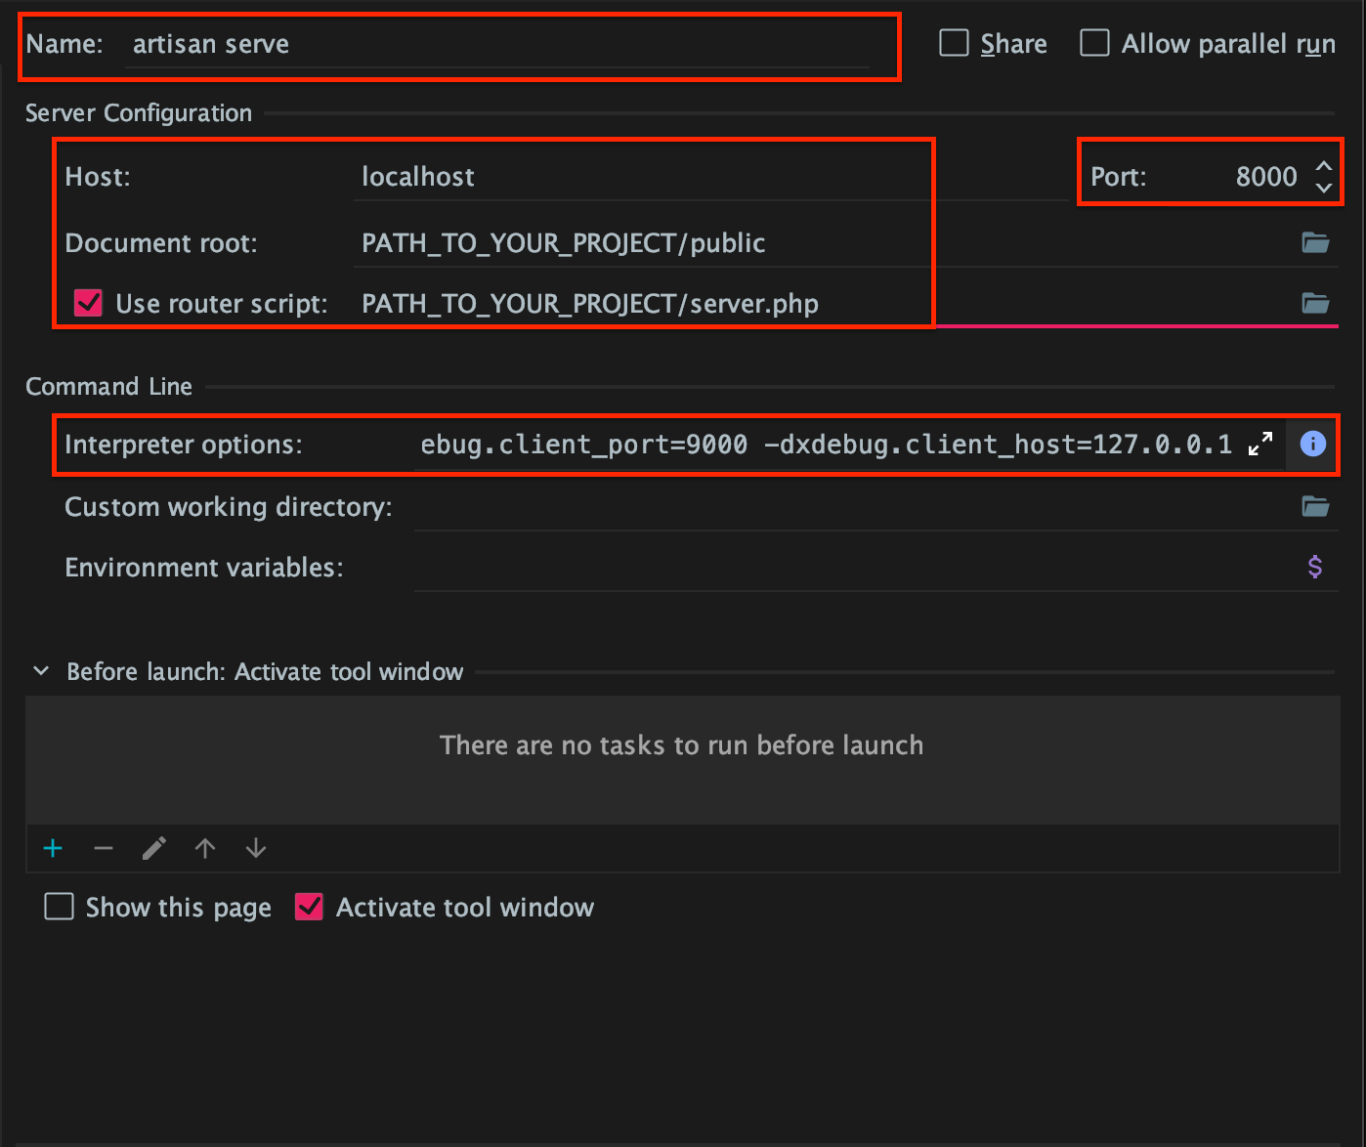
- Name: artisan serve (depend on you)
- Host: localhost
- Port: 8000 (this is default port for Laravel Artisan Web Server)
- Document Root: Your project “public” folder
- Tick “Use router script” checkbox and set value to your project “server.php” file
- Interpreter Options: Copy / Paste the below values
-dxdebug.mode=debug -dxdebug.start_with_request=trigger -dxdebug.client_port=9000 -dxdebug.client_host=127.0.0.1And that’s it ! Now you can start to debug your Laravel project like a Pro !!!
6. Let’s test !
6.1 Enable Start Listening for PHP Debug Connection in PHPStorm Run menu

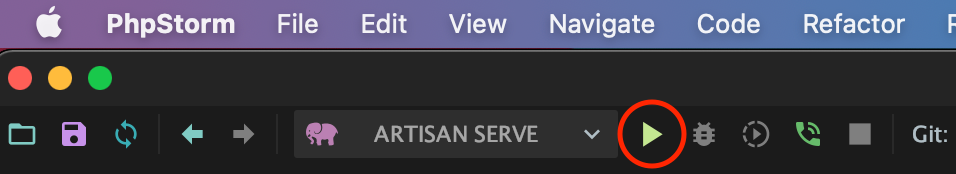
6.2 Run the artisan serve built-in PHP server
6.3 Now open Chrome browser, go to http://localhost:8000
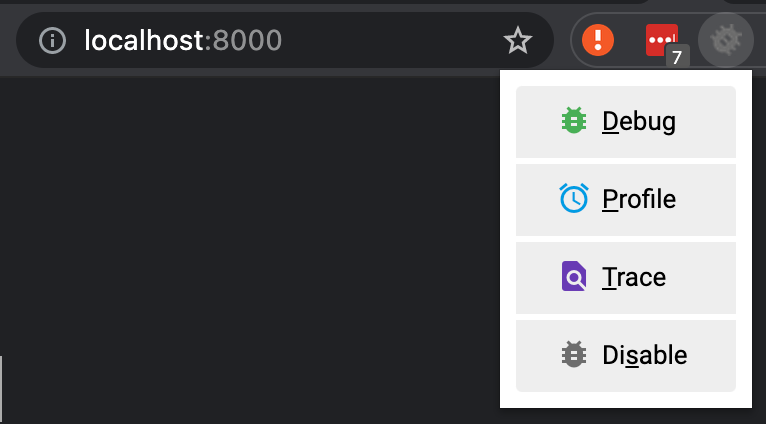
6.4 Make sure to enable XDebug Helper in Chrome
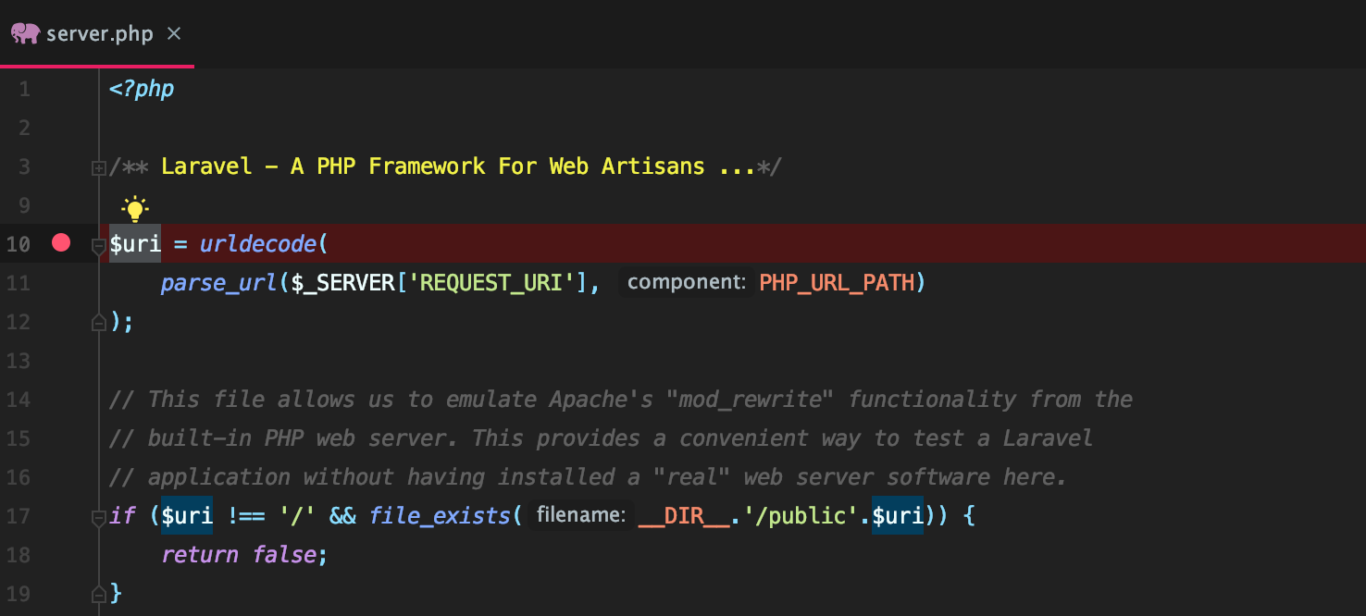
6.5 Set a breakpoint in your source code
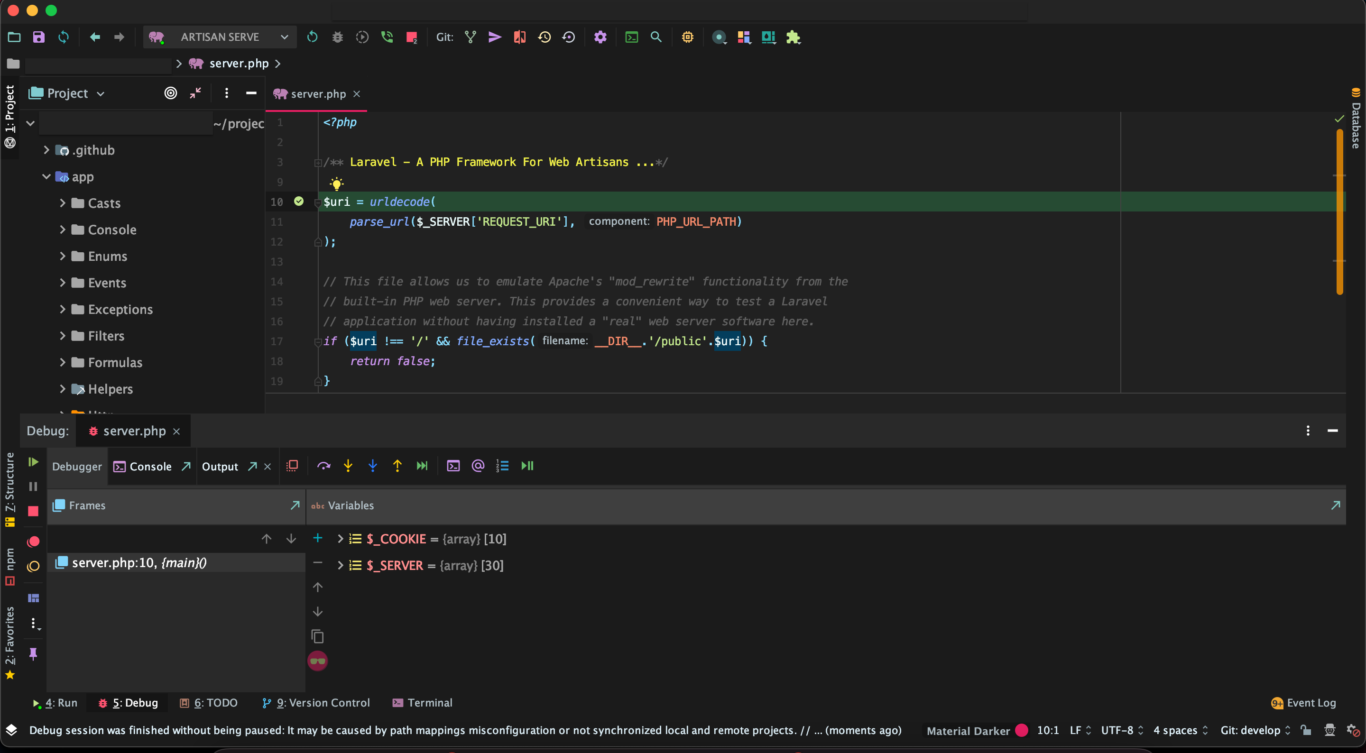
6.6 Refresh Chrome, PHPStorm should have shown you Debug window now !
Happy debugging & thanks for reading !